Backend Observability: Logs, Metrics, Traces, and Alerts
A comprehensive engineering guide to backend observability: RED and USE metrics, structured logging, OpenTelemetry distributed tracing, tail sampling, and SRE error budget alerting.
Backend Observability: Logs, Metrics, Traces, and Alerts
Observability is a measure of how effectively an engineering team can infer the internal execution state of a system solely from its external telemetry outputs. In a traditional monolithic architecture running on a single virtual machine, diagnosing an incident often came down to tailing a log file, inspecting a single stack trace, or observing a CPU graph.
Modern distributed architectures dismantle those assumptions. When a single user action cascades across an API gateway, multiple microservices, asynchronous message queues, distributed caches, and partitioned databases, failure modes become non-linear. An error surfaced by a downstream worker might be caused by an unpropagated deadline from an upstream gateway or connection pool starvation in an adjacent service.
Without structured telemetry, engineers spend incidents navigating disconnected dashboards, manually aligning timestamps across disparate log aggregators, and guessing at causality. A production-grade observability architecture unifies metrics, logs, and distributed traces into a cohesive diagnostic pipeline, backed by Service Level Objectives (SLOs) and error-budget alerting that protect user experience without fatiguing on-call teams.
The Telemetry Triad and Modern Convergence
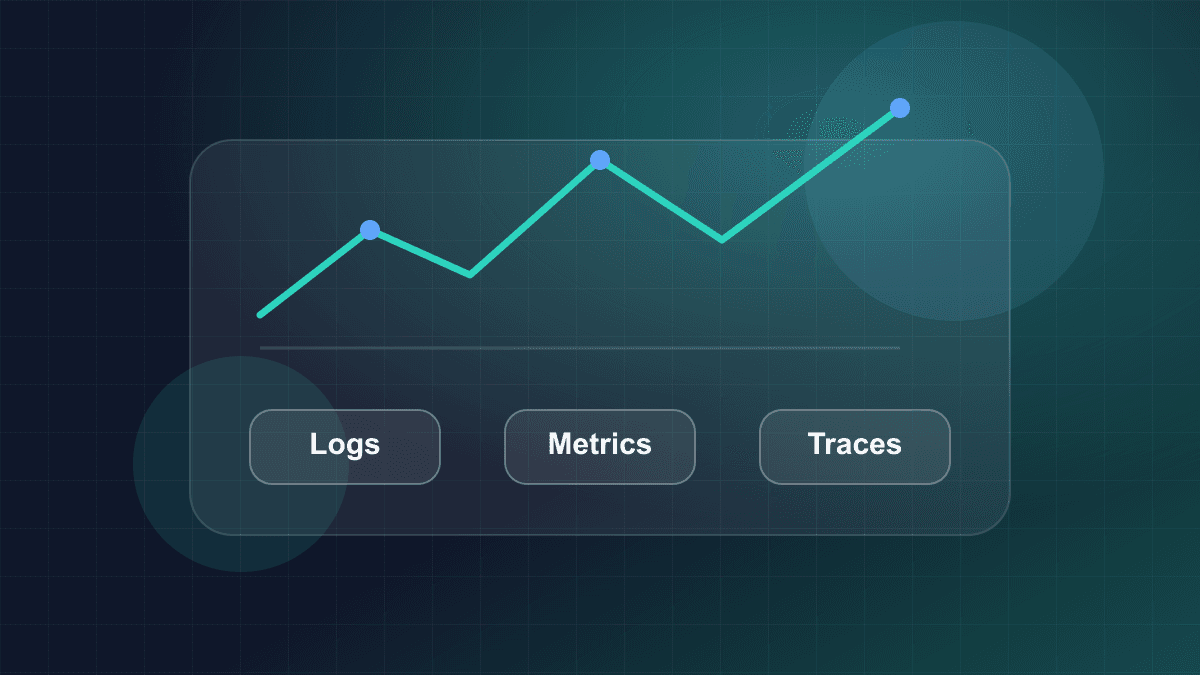
Telemetry is traditionally categorized into three distinct signals: metrics, logs, and distributed traces. While each signal addresses a different operational question, modern observability architectures rely on their convergence rather than treating them as isolated silos.
+-------------------------------------------------------------------------+
|                         Observability Convergence                       |
+-------------------------------------------------------------------------+
|  METRICS                    TRACES                      LOGS            |
|  (Aggregation)              (Execution Path)            (Event Context) |
|                                                                         |
|  Detect anomalies           Isolate bottlenecks         Inspect state   |
|  Low cost / high retention  Causal transaction DAG      High detail     |
|          \                     /                           /            |
|           \                   /                           /             |
|            +----> [EXEMPLARS] <                          /              |
|                     Jump directly from metric           /               |
|                     spike to specific TraceID          /                |
|                                \                      /                 |
|                                 +-> [TRACE CONTEXT] <-+                 |
|                                     Correlate spans with                |
|                                     structured log records              |
+-------------------------------------------------------------------------+
Metrics: Aggregate System Health
Metrics represent numeric values measured over intervals of time, optimized for real-time aggregation and mathematical analysis. They answer the question: Is the system healthy, and where is the trend heading?
Because metrics compress raw activity into time-series data points (such as counters, gauges, and histograms), their storage footprint remains predictable regardless of request throughput. This efficiency makes metrics the primary driver for real-time dashboards and threshold detection. However, metrics lack individual execution context; an aggregate histogram reveals that the 99th percentile latency spiked to 2.8 seconds, but cannot explain which specific request experienced that delay or why.
Structured Logs: Contextual Event Records
Logs capture discrete, timestamped events emitted during program execution. They answer the question: What specific state existed when an event occurred?
Unstructured text strings formatted via standard logging formatters create significant indexing overhead and require complex regular expressions to query. In production, logs must be emitted as structured payloads (typically JSON) containing standard key-value pairs:
{
  "timestamp": "2025-09-23T14:32:01.408Z",
  "level": "ERROR",
  "service": "billing-service",
  "message": "Payment processing failed via gateway",
  "trace_id": "4bf92f3577b34da6a3ce929d0e0e4736",
  "span_id": "00f067aa0ba902b7",
  "customer_id": "cust_98234",
  "gateway_error_code": "CARD_DECLINED",
  "http_status": 402
}
Structured logs provide rich localized context, but their storage and indexing costs scale linearly with transaction volume. Without explicit sampling or log-level governance, high-throughput systems can easily spend more on log indexing infrastructure than on primary compute resources.
Distributed Traces: Causal Execution Topologies
Distributed tracing models the end-to-end journey of a request as it traverses network boundaries, asynchronous queues, and thread pools. It answers the question: Where did a transaction spend its time, and which dependency failed?
A trace is represented as a Directed Acyclic Graph (DAG) of spans. A span represents a contiguous unit of work, defined by a start time, end time, name, status, and metadata attributes. Every trace shares a globally unique trace_id. Each child span references its caller via a parent_span_id, establishing an explicit causal hierarchy across decoupled services.
| Telemetry Signal | Fundamental Unit | Storage Cost Profile | Cardinality Tolerance | Primary Diagnostic Strength | Inherent Limitation | | :--- | :--- | :--- | :--- | :--- | :--- | | Metrics | Aggregated time series | Fixed per series (Low) | Very Low (Bounded labels only) | Rapid anomaly detection & alerting | Lacks individual request context | | Structured Logs | Discrete event payload | Linear with event volume (High) | High (Indexed key-value pairs) | Granular local state & forensics | Disconnected without trace correlation | | Distributed Traces | Span in execution DAG | Proportional to sampled spans (Medium) | High (Within span attributes) | Cross-service latency & causality | High bandwidth without intelligent sampling |
The Mechanics of Convergence
Treating these three signals as separate tools forces engineers to perform manual mental joins during outages. Modern systems bridge them using two foundational standards:
- Trace-to-Log Correlation: By injecting the active
trace_idandspan_idinto every structured log record (via execution context or logging middlewares), log search engines can instantly filter all logs generated across twenty microservices for a single failing transaction. - Exemplars: An exemplar is a direct reference to an external trace attached to a specific metric data point in an OpenMetrics or Prometheus histogram. When an engineer views a metric graph showing a spike in the bucket
http_request_duration_seconds_bucket{le="2.5"}, the visualizer renders an exemplar marker. Clicking that marker extracts the associatedtrace_idand immediately opens the exact trace in a distributed tracing UI, eliminating guesswork.
Systematic Measurement: RED vs. USE Methodologies
Effective monitoring requires a standardized framework for selecting what to measure. Arbitrary metric collection leads to dashboard sprawl, where hundreds of charts exist but none provide a clear picture of system health. Two established methodologies provide architectural clarity: the RED method for services, and the USE method for resources.
+-----------------------------------------------------------------------+
|                 Layered Telemetry: RED and USE                        |
+-----------------------------------------------------------------------+
|  APPLICATION & SERVICE LAYER  ===>  RED METHOD                        |
|  (Inbound HTTP/gRPC Requests)       - Rate (requests per second)      |
|                                     - Errors (failed requests/sec)    |
|                                     - Duration (latency distribution) |
+-----------------------------------------------------------------------+
|  INFRASTRUCTURE & RESOURCE LAYER  ===>  USE METHOD                    |
|  (CPU, Memory, Disks, Pools)            - Utilization (% time busy)   |
|                                         - Saturation (queue depth)    |
|                                         - Errors (fault event count)  |
+-----------------------------------------------------------------------+
The RED Method for Request-Driven Services
Formulated by Tom Wilkie, the RED method focuses on request-driven services (such as HTTP APIs, gRPC endpoints, and message consumers). It measures the user-facing experience:
- Rate: The volume of requests the service is handling per second (requests/second).
- Errors: The number of requests that fail per second (e.g., HTTP 5xx responses or unhandled exceptions).
- Duration: The time taken to process requests, evaluated as a distribution (percentiles such as p50, p95, and p99) rather than an arithmetic mean.
Arithmetic averages disguise tail latency; if 99 requests take 10ms and 1 request takes 10 seconds, the average latency is approximately 110ms, concealing the fact that 1% of users suffered an unacceptable delay. Histograms preserve latency distributions across dynamic traffic loads.
The USE Method for Resource Bottlenecks
Formulated by Brendan Gregg, the USE method applies to finite resources—both hardware (CPU, physical memory, storage disks, network interfaces) and software constructs (database connection pools, worker thread pools, socket buffers):
- Utilization: The percentage of time that the resource was actively busy servicing work (e.g., CPU busy time at 72%).
- Saturation: The degree to which extra work has accumulated and is forced to wait in a queue because the resource is at capacity (e.g., CPU run queue length, thread pool queue depth, disk I/O wait queues).
- Errors: The count of discrete error events encountered by the resource (e.g., dropped network packets, disk write faults, out-of-memory kernel kills).
| Dimension | RED Method | USE Method | | :--- | :--- | :--- | | Primary Focus | Work and customer experience | Components, capacity, and infrastructure | | Target Layer | Request endpoints, APIs, background jobs | Hardware, kernel subsystems, connection pools | | Key Questions | How much work is arriving? How fast is it done? | Is the resource at capacity? Are tasks waiting? | | Core Primitives | Counter (Rate, Errors), Histogram (Duration) | Gauge (Utilization, Saturation), Counter (Errors) | | Incident Trigger | Latency degradation or error spike | Resource exhaustion or queue backlog |
Correlating RED and USE During an Incident
In production, RED and USE metrics operate as complementary diagnostic layers:
- A frontend gateway reports an alert on Duration (RED): 99th percentile checkout latency increases from 180ms to 4.2 seconds.
- The error rate remains low, but the request Rate (RED) remains constant, indicating a latency bottleneck rather than a traffic spike.
- The engineer inspects the database cluster's Utilization (USE): CPU utilization is low (35%), but connection pool Saturation (USE) shows 150 requests queued waiting for an available connection thread.
- The root cause is identified: a downstream slow query was holding open database pool connections, saturating the connection pool and backing up requests across the application layer.
The Cardinality Trap in Metric Databases
A primary failure mode in metrics systems is cardinality explosion. In time-series databases (TSDBs) such as Prometheus, M3DB, or VictoriaMetrics, each unique combination of metric name and label key-value pairs instantiates an entirely distinct time series:
Where represents the count of unique values for label dimension .
The Mechanics of an Index Crash
Consider an HTTP request duration metric:
http_server_duration_seconds_bucket{service="billing", route="/checkout", method="POST", status="200"}
If the dimensions are strictly bounded:
service: 5 valuesroute: 40 distinct route patternsmethod: 4 HTTP verbs (GET,POST,PUT,DELETE)status: 10 status code classesle(histogram buckets): 12 boundaries
The resulting time series count is:
A small Prometheus deployment handles 96,000 active series with minimal memory consumption.
However, suppose an engineer introduces an unbounded dynamic label into the metric, such as user_id ( values) or order_id ( values):
The TSDB must allocate in-memory inverted index entries (postings lists) for every unique series. Memory usage escalates exponentially, the garbage collector enters continuous compaction loops, query engines time out, and the metric server crashes with an Out-Of-Memory (OOM) error.
+-------------------------------------------------------------------------+
|                    Metric vs. Trace Data Partition                      |
+-------------------------------------------------------------------------+
|  BOUNDED DIMENSIONS  ===> TIME-SERIES DATABASE (Prometheus, M3)         |
|  - service: "order-api"                                                 |
|  - route: "/orders/:id" (parameterized pattern, not literal ID)         |
|  - method: "POST"                                                       |
|  - status_code: "201"                                                   |
+-------------------------------------------------------------------------+
|  HIGH-CARDINALITY    ===> DISTRIBUTED TRACES & STRUCTURED LOGS           |
|  - user_id: "usr_9934a-81f2"                                            |
|  - order_id: "ord_11029384"                                             |
|  - ip_address: "198.51.100.42"                                          |
|  - stack_trace / error details                                          |
+-------------------------------------------------------------------------+
Cardinality Governance Rules
To prevent cardinality degradation:
- Never use dynamic identifiers as metric labels: IDs (UUIDs, tenant IDs, email addresses, order IDs) must never be added to metric dimensions.
- Normalize URI paths: Ensure instrumentation frameworks capture parameterized route templates (e.g.,
/api/v1/users/:id) rather than the raw request URI (/api/v1/users/a98f-431e). - Delegate high-cardinality values to traces and logs: Store dynamic metadata as OpenTelemetry span attributes or structured log fields, which are ingested into columnar storage engines (e.g., ClickHouse) or distributed document stores designed for large-scale key search without series fragmentation.
OpenTelemetry Architecture: API, SDK, and Collector
The Cloud Native Computing Foundation (CNCF) OpenTelemetry (OTel) project provides the standard, vendor-neutral framework for collecting, processing, and exporting telemetry data across distributed backends.
+-------------------------------------------------------------------------+
|                     OpenTelemetry Application Architecture              |
+-------------------------------------------------------------------------+
|  Application Code / Shared Libraries                                    |
|      │                                                                  |
|      ▼ depends strictly on                                              |
|  OpenTelemetry API (@opentelemetry/api)                                 |
|  - Interfaces: Tracer, Meter, Context, Span                             |
|  - Zero operational overhead / defaults to No-Op                        |
+-------------------------------------------------------------------------+
|  Application Bootstrap Layer (main.ts / instrumentation.ts)              |
|      │                                                                  |
|      ▼ configures runtime engine                                        |
|  OpenTelemetry SDK (@opentelemetry/sdk-node)                            |
|  - Samplers, Batch Processors, Resource Detectors                       |
|  - OTLP Exporter                                                        |
+-------------------------------------------------------------------------+
                                 │
                                 │ OTLP / gRPC (Port 4317)
                                 ▼
+-------------------------------------------------------------------------+
|                     OpenTelemetry Collector Pipeline                    |
|                                                                         |
|   +---------------+      +--------------------+      +---------------+  |
|   |   RECEIVERS   | ---> |     PROCESSORS     | ---> |   EXPORTERS   |  |
|   |  - otlp/grpc  |      |  - memory_limiter  |      |  - otlp/tempo |  |
|   |  - otlp/http  |      |  - batch           |      |  - prometheus |  |
|   |  - prometheus |      |  - tail_sampling   |      |  - clickhouse |  |
|   +---------------+      +--------------------+      +---------------+  |
+-------------------------------------------------------------------------+
API vs. SDK Decoupling
A critical architectural design in OpenTelemetry is the strict separation between the API and the SDK:
- OpenTelemetry API: Defines the abstract types, tracer interfaces, meter signatures, and context propagation functions. It contains no background workers, no network clients, and no operational state. Application libraries and internal modules import only the API. If no implementation is registered at runtime, the API defaults to no-op implementations, consuming near-zero CPU and allocating no memory buffers.
- OpenTelemetry SDK: The concrete execution engine. It manages thread pools, in-memory ring buffers, sampling algorithms, batching schedulers, and network exporters. The SDK is imported and configured once at the application entry point (e.g., before any other module loads during process bootstrap).
This decoupling ensures that shared internal packages (such as database wrappers or HTTP clients) never bind the entire system to a specific telemetry vendor, collector address, or network transport.
The OpenTelemetry Collector Pipeline
Rather than having microservices export telemetry directly to multiple storage backends, production architectures route telemetry through an OpenTelemetry Collector. The Collector operates as a high-performance proxy written in Go, organized into linear pipelines:
- Receivers: Ingestion points that accept telemetry in various formats (OTLP over gRPC on port 4317, OTLP over HTTP on port 4318, Prometheus scrapes, or Zipkin payloads).
- Processors: In-flight transformation stages applied sequentially:
memory_limiter: Drops telemetry or applies backpressure when the Collector process approaches configured memory limits, preventing out-of-memory process crashes.batch: Buffers incoming spans and metrics into larger chunks, reducing network overhead and HTTP/2 framing costs.transform(OTTL): Uses the OpenTelemetry Transformation Language to redact Personally Identifiable Information (PII), drop unwanted attributes, or standardize legacy tag formats.tail_sampling: Buffers complete traces across services to make intelligent retention decisions before long-term storage.
- Exporters: Translates processed telemetry into target backend protocols (OTLP to distributed trace stores, Prometheus remote write, ClickHouse, or cloud logging engines).
- Connectors: Bridges pipelines internally (for instance, the
spanmetricsconnector computes RED metrics directly from incoming trace spans and forwards them to a metrics pipeline).
The OTLP Wire Protocol
The OpenTelemetry Protocol (OTLP) standardizes data serialization using Protocol Buffers (protobuf). Compared to legacy text-based JSON APIs, OTLP drastically reduces payload sizes, eliminates string parsing overhead, and supports multiplexed binary streaming over gRPC (HTTP/2) or binary HTTP/1.1.
Sampling Mechanics: Head-Based vs. Tail-Based Sampling
High-throughput distributed systems can generate tens of billions of spans daily. Storing 100% of traces at scale is financially and operationally impractical. The challenge lies in reducing trace volume without discarding the rare anomalies engineers need to debug.
+-------------------------------------------------------------------------+
|                  Head-Based vs. Tail-Based Sampling                     |
+-------------------------------------------------------------------------+
|  HEAD-BASED SAMPLING (At Ingress)                                       |
|  Request Ingress -> [Probabilistic Decision (e.g. 5%)]                   |
|                        ├── Sampled (01)   --> Propagated downstream     |
|                        └── Dropped (00)   --> Trace dropped immediately |
|  * Low collector memory, but drops 95% of rare 5xx errors!              |
+-------------------------------------------------------------------------+
|  TAIL-BASED SAMPLING (At Collector Gateway Tier)                        |
|  All spans collected -> [In-Memory Buffer (e.g. 30s Window)]            |
|                             │                                           |
|                             ├── Status == ERROR?  --> Retain 100%       |
|                             ├── Duration > 2.0s?  --> Retain 100%       |
|                             └── Normal 200 OK?    --> Retain 1%         |
|  * 100% capture of errors and slow requests, requires collector memory  |
+-------------------------------------------------------------------------+
Head-Based Sampling
In head-based sampling, the sampling decision is made at the moment the request enters the system (e.g., at the API gateway or root service) before any work has occurred:
- The root service makes a probabilistic decision (e.g., sample 5% of requests) or evaluates a rate limiter (e.g., maximum 50 traces per second).
- The decision is encoded in the W3C Trace Context
traceparentheader flag (setting the least significant bit:01for sampled,00for not sampled). - Downstream services read this flag and immediately discard unsampled spans without allocating trace state or invoking network exporters.
Strengths: Minimal memory and network overhead. Downstream services avoid exporting 95% of spans, keeping resource consumption low.
Critical Weakness: The decision is made before the request executes. If an unhandled database exception or an unexpected 5-second latency spike occurs on only 0.05% of requests, a 5% head sampler will discard 95% of those failing traces. The very incidents that require deep diagnostics are dropped.
Tail-Based Sampling
Tail-based sampling defers the retention decision until the transaction has completed execution across all distributed services:
- Backend services export 100% of their generated spans to a tier of OpenTelemetry Collectors.
- The Collectors buffer the spans in memory, grouping them by
trace_idfor a defined time window (e.g., 20 to 30 seconds). - Once the trace completes (or the buffer window elapses), the Collector evaluates a set of rules against the complete trace:
- If any span contains an error status (
status.code == ERRORor HTTP status >= 500): Retain 100%. - If total trace duration exceeds a latency threshold (e.g., duration ): Retain 100%.
- If the trace represents a specific critical business transaction: Retain 50%.
- Otherwise, for standard successful requests: Sample 1%.
- If any span contains an error status (
Strengths: Guarantees that every anomalous, slow, or failed transaction is retained for root-cause analysis while drastically reducing steady-state storage costs.
Operational Trade-offs:
- Collector Memory: The Collector cluster must allocate substantial memory buffers to hold in-flight traces across all services.
- Trace-Aware Routing: Spans belonging to the same
trace_idmust reach the same Collector instance to evaluate the complete trace. This requires a two-tier collector topology using aloadbalancingexporter configured with consistent hashing ontrace_id.
| Characteristic | Head-Based Sampling | Tail-Based Sampling | | :--- | :--- | :--- | | Decision Point | Request ingress (root service) | Post-execution (Collector cluster) | | Downstream Agent Overhead | Negligible (drops unsampled spans at source) | Moderate (must export 100% of spans to collectors) | | Outlier Retention | Probabilistic (high risk of dropping rare bugs) | Deterministic (100% capture of errors and slow paths) | | Collector Infrastructure | Lightweight stateless proxies | High-memory instances with trace-aware routing | | Implementation Complexity | Low (standard SDK configuration) | Higher (requires collector cluster orchestration) |
End-to-End Distributed Tracing in Practice
The following self-contained TypeScript implementation demonstrates production-grade manual instrumentation using the official @opentelemetry/api package. It illustrates W3C Trace Context extraction, server span lifecycle management, contextual child execution, and context injection into outbound client requests.
import {
  trace,
  context,
  propagation,
  SpanStatusCode,
  SpanKind,
  type Context,
  type Span,
  type TextMapGetter,
  type TextMapSetter,
} from "@opentelemetry/api";

// 1. Obtain a tracer from the global registry
const tracer = trace.getTracer("order-processing-service", "1.4.0");

// 2. W3C Trace Context Getter for inbound HTTP headers
const httpHeaderGetter: TextMapGetter<Record<string, string | string[] | undefined>> = {
  get(carrier, key) {
    const value = carrier[key.toLowerCase()];
    if (Array.isArray(value)) return value[0];
    return value;
  },
  keys(carrier) {
    return Object.keys(carrier);
  },
};

// 3. W3C Trace Context Setter for outbound HTTP headers
const httpHeaderSetter: TextMapSetter<Record<string, string>> = {
  set(carrier, key, value) {
    carrier[key] = value;
  },
};

interface OrderPayload {
  orderId: string;
  customerId: string;
  amountCents: number;
}

/**
 * Handles incoming HTTP request: extracts context, records server span,
 * executes business logic within active context, and handles exceptions.
 */
export async function handleOrderRequest(
  inboundHeaders: Record<string, string | string[] | undefined>,
  payload: OrderPayload
): Promise<{ success: boolean }> {
  // Extract inbound W3C traceparent/tracestate context
  const extractedContext: Context = propagation.extract(
    context.active(),
    inboundHeaders,
    httpHeaderGetter
  );

  // Start root server span within the extracted context
  return tracer.startActiveSpan(
    "POST /orders",
    {
      kind: SpanKind.SERVER,
      attributes: {
        "http.request.method": "POST",
        "http.route": "/orders",
        "order.id": payload.orderId,
        "customer.id": payload.customerId,
      },
    },
    extractedContext,
    async (serverSpan: Span) => {
      try {
        // Execute domain work as a child span within this active span context
        await processPayment(payload);

        serverSpan.setStatus({ code: SpanStatusCode.OK });
        serverSpan.setAttribute("http.response.status_code", 201);
        return { success: true };
      } catch (err: unknown) {
        const error = err instanceof Error ? err : new Error(String(err));

        // Record exception event and mark span status as ERROR
        serverSpan.recordException(error);
        serverSpan.setStatus({
          code: SpanStatusCode.ERROR,
          message: error.message,
        });
        serverSpan.setAttribute("http.response.status_code", 500);

        throw error;
      } finally {
        // Always terminate the span to record duration and queue for export
        serverSpan.end();
      }
    }
  );
}

/**
 * Child task executing an outbound client call: injects active W3C trace
 * context into outgoing headers so downstream services link their spans.
 */
async function processPayment(payload: OrderPayload): Promise<void> {
  // Creating a child span implicitly inherits the active context from startActiveSpan
  return tracer.startActiveSpan(
    "payment_gateway.charge",
    {
      kind: SpanKind.CLIENT,
      attributes: {
        "rpc.system": "http",
        "net.peer.name": "payment.gateway.internal",
        "payment.amount_cents": payload.amountCents,
      },
    },
    async (clientSpan: Span) => {
      try {
        const outboundHeaders: Record<string, string> = {
          "content-type": "application/json",
        };

        // Inject active trace context (traceparent) into outbound headers
        propagation.inject(context.active(), outboundHeaders, httpHeaderSetter);

        // Simulate network call carrying W3C trace context header
        await performMockHttpRequest("https://payment.gateway.internal/charge", outboundHeaders);

        clientSpan.setStatus({ code: SpanStatusCode.OK });
      } catch (err: unknown) {
        const error = err instanceof Error ? err : new Error(String(err));
        clientSpan.recordException(error);
        clientSpan.setStatus({
          code: SpanStatusCode.ERROR,
          message: error.message,
        });
        throw error;
      } finally {
        clientSpan.end();
      }
    }
  );
}

async function performMockHttpRequest(url: string, headers: Record<string, string>): Promise<void> {
  // Outbound headers now contain 'traceparent', e.g.:
  // '00-4bf92f3577b34da6a3ce929d0e0e4736-00f067aa0ba902b7-01'
  if (!headers.traceparent) {
    throw new Error("Context propagation failed: missing traceparent header");
  }
}
Key Implementation Principles
- Context Extraction: Incoming HTTP requests must extract context using
propagation.extractbefore starting a span. Without this, every incoming request starts a disconnected trace instead of joining the caller's distributed DAG. - Context Injection: Outgoing network calls must inject the active context into outbound transport headers via
propagation.inject. This maintains causal linkage across message brokers, gRPC services, and external HTTP clients. - Structured Error Handling: Throwing an exception does not automatically flag a span as failed in OpenTelemetry. You must explicitly call
span.recordException(err)to capture the stack trace event and set the status toSpanStatusCode.ERROR. - Deterministic Closure in Finally Blocks: Always close spans inside a
finally { span.end(); }block to guarantee that duration timers stop and memory buffers release even when unhandled exceptions occur.
Reliability Engineering: SLOs and Error Budget Alerting
Traditional infrastructure alerting relies on static resource thresholds: Alert if CPU utilization exceeds 85% for 5 minutes, or Alert if error rate exceeds 2%. These static alerts suffer from two fundamental flaws:
- False Positives: A batch processing job causing 95% CPU utilization during off-peak hours triggers an on-call page even though user requests are unaffected.
- False Negatives: A steady 0.8% failure rate on a critical login endpoint during peak morning traffic goes unnoticed by a 2% threshold, quietly locking thousands of users out of their accounts.
Site Reliability Engineering (SRE) replaces static thresholds with Service Level Objectives (SLOs) and Error Budget Burn Rate Alerting.
+-------------------------------------------------------------------------+
|                  Service Level Formulation Framework                    |
+-------------------------------------------------------------------------+
|  SLI (Service Level Indicator)                                          |
|  Quantifiable metric of good events vs. total valid events:             |
|                                                                         |
|            Sum of Successful Requests (HTTP < 500 & Duration <= 300ms)  |
|    SLI  =  -----------------------------------------------------------  |
|                            Sum of Valid Requests                        |
+-------------------------------------------------------------------------+
|  SLO (Service Level Objective)                                          |
|  Target reliability agreed over a rolling compliance window (30 days):  |
|  Example: 99.9%                                                         |
+-------------------------------------------------------------------------+
|  ERROR BUDGET                                                           |
|  Permitted failure rate before violating reliability commitments:       |
|  Error Budget = 1 - SLO = 1 - 0.999 = 0.001 (0.1% allowable failure)    |
|  In 30 days (43,200 minutes), allows exactly 43.2 minutes downtime.     |
+-------------------------------------------------------------------------+
The Burn Rate Formulation
The Burn Rate is the acceleration factor at which an outage consumes the allocated error budget relative to the compliance window:
- A Burn Rate of 1.0 indicates that the system will consume exactly 100% of its error budget over the course of the 30-day window. This represents the steady-state boundary of acceptable reliability.
- A Burn Rate of 14.4 consumes 100% of the entire 30-day error budget in just 50 hours:
Crucially, a burn rate of 14.4 consumes 2% of the 30-day error budget in exactly 1 hour ().
Google SRE Multi-Window Multi-Burn-Rate Alerting
Alerting on a single time window creates a severe operational trade-off:
- If you alert on a short window (e.g., 5 minutes), transient network blips trigger false alarms, but resets occur quickly once the blip passes.
- If you alert on a long window (e.g., 1 hour), you avoid transient false alarms, but on-call engineers receive pages for an hour after an incident has already resolved because the 1-hour average remains elevated.
Google SRE solves this by requiring two simultaneous conditions: a long window (to ensure significant budget consumption) AND a short window (to confirm that the incident is still actively occurring right now).
| Severity Level | Action Channel | Burn Rate | Long Window | Short Window | Budget Consumed | | :--- | :--- | :--- | :--- | :--- | :--- | | Page (P1) | Immediate PagerDuty | 14.4 | 1 Hour | 5 Minutes | 2.0% | | Page (P2) | Immediate PagerDuty | 6.0 | 6 Hours | 30 Minutes | 5.0% | | Ticket (P3) | Next business day | 1.0 | 3 Days | 6 Hours | 10.0% |
Prometheus Alerting Rule Example
The following Prometheus rule alerts on a 14.4x burn rate over an SLO of 99.9% (, so the alert threshold is or error rate):
groups:
  - name: order_service_slo_alerts
    rules:
      - alert: OrderServiceHighErrorBudgetBurn
        expr: |
          (
            sum(rate(http_requests_total{job="order-service",status=~"5.."}[1h]))
            /
            sum(rate(http_requests_total{job="order-service"}[1h]))
          ) > (14.4 * (1 - 0.999))
          and
          (
            sum(rate(http_requests_total{job="order-service",status=~"5.."}[5m]))
            /
            sum(rate(http_requests_total{job="order-service"}[5m]))
          ) > (14.4 * (1 - 0.999))
        for: 2m
        labels:
          severity: page
        annotations:
          summary: "High error budget burn rate (14.4x) on order-service"
          description: "Consuming 2% of the 30-day error budget within 1 hour. Current active failure confirmed over 5m window."
Common Backend Observability Anti-Patterns
Even well-funded engineering organizations stumble over avoidable architectural traps:
1. High-Cardinality Pollution in Metrics
- The Anti-Pattern: Appending raw URL paths (e.g.,
/api/orders/9f381a), user IDs, or error message strings into Prometheus labels. - The Consequence: Explosive memory growth, compaction lockups, and TSDB process crashes.
- The Fix: Enforce static label bounds in CI linting. Route unbounded identifiers into distributed trace span attributes and structured logs.
2. Disconnected Log Silos
- The Anti-Pattern: Emitting unstructured log strings or structured JSON logs that lack trace correlation identifiers.
- The Consequence: Engineers during an incident must manually guess time windows, correlate IP addresses across logs, and piece together execution order.
- The Fix: Configure logger formatters to automatically pull the active
trace_idandspan_idfrom OpenTelemetry context.
3. Missing Collector Memory Limiters
- The Anti-Pattern: Deploying OpenTelemetry Collectors without a
memory_limiterprocessor at the top of the processor pipeline. - The Consequence: During upstream traffic spikes, collectors buffer data until the Linux kernel terminates the process via OOM kill, dropping telemetry during the exact moment an incident occurs.
- The Fix: Always configure
memory_limiteras the first processor in every pipeline with explicit soft and hard memory limits (e.g., 75% limit, 80% spike limit).
4. Alerting on Synthetic Symptoms Rather Than User Impact
- The Anti-Pattern: Paging engineers on high CPU utilization, memory consumption spikes, or individual container restarts.
- The Consequence: Alarm fatigue. Engineers ignore pages or silence alert channels, leading to delayed responses when customer-impacting outages occur.
- The Fix: Page exclusively on multi-window error budget burn rate alerts derived from user-facing SLIs. Route infrastructure resource anomalies to informational dashboards and internal tickets.
A Production Observability Checklist
Before promoting a new backend service or platform architecture to production, verify the following readiness criteria:
Instrumentation & Architecture
- [ ] Application modules depend strictly on the OpenTelemetry API; the SDK is initialized exclusively at application bootstrap.
- [ ] Inbound HTTP/gRPC middlewares extract W3C Trace Context (
traceparent) using standard context getters. - [ ] Outbound HTTP clients, database connectors, and message queue producers inject active trace context into request headers.
- [ ] Spans record exceptions with
span.recordException(err)and set status toSpanStatusCode.ERRORon failure. - [ ] Span lifecycle is guaranteed using
finally { span.end(); }to prevent memory leaks and incomplete traces.
Collector & Sampling Infrastructure
- [ ] OpenTelemetry Collectors deploy with
memory_limiterconfigured as the first processor in every pipeline. - [ ] Batch processors are configured with appropriate timeout and max-size parameters to minimize network transmission costs.
- [ ] High-throughput systems implement tail-based sampling on a centralized Collector tier to retain 100% of errors and latency outliers while sampling normal transactions.
- [ ] Spans are routed to collectors using consistent trace-id hashing to ensure complete trace evaluation in tail sampling.
Metrics & Cardinality Governance
- [ ] Request-handling services export the RED triad (Rate, Errors, Duration) using parameterized route templates.
- [ ] Host and container resources monitor the USE triad (Utilization, Saturation, Errors).
- [ ] No dynamic identifiers (UUIDs, user IDs, raw query strings) exist in metric label keys or values.
- [ ] Exemplars are enabled to link Prometheus histogram buckets directly to active TraceIDs.
Alerting & Reliability
- [ ] Core business journeys possess explicitly defined Service Level Indicators (SLIs) and 30-day Service Level Objectives (SLOs).
- [ ] Alerting rules utilize Google SRE multi-window multi-burn-rate algorithms (combining short and long evaluation windows).
- [ ] Every on-call page links directly to an actionable triage runbook and a pre-filtered tracing dashboard.
- [ ] Telemetry storage retention policies and compaction tiers are established to manage cloud infrastructure costs.
Conclusion
Backend observability is not a vendor product, a collection of static dashboards, or an arbitrary checklist of monitoring agents. It is an engineering discipline that structures telemetry data so that complex, non-linear failure modes in distributed systems can be systematically understood and resolved.
By pairing the RED method for user-facing services with the USE method for underlying resources, teams gain immediate clarity on system behavior. By strictly bounding metric cardinality and delegating high-dimension context to OpenTelemetry distributed traces and correlated structured logs, observability pipelines remain resilient under extreme load. Finally, by transitioning from noisy threshold alerting to multi-window error budget burn rate alerting, teams protect their users from degradation while shielding their engineers from operational burnout.